2015 300cc Enduro Shootout: Extras
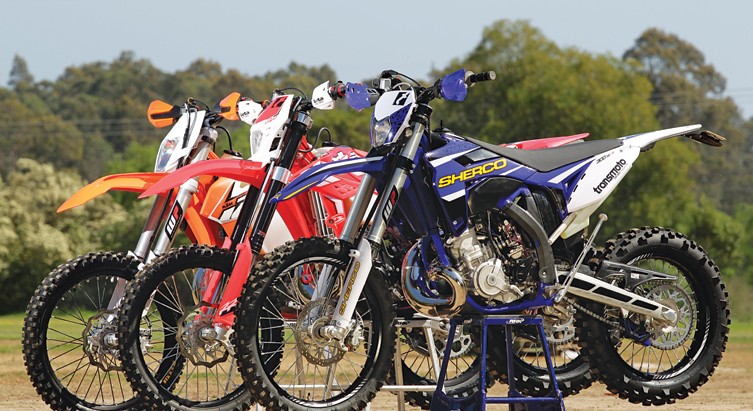
So by now, you would have checked out Transmoto‘s 2015 300cc Enduro Bike Shootout that appears in our 2014 November-December (#47) issue. Here’s an insight into how our testing system works, and a little bit more information about the Beta, Sherco and KTM, that we couldn’t quite squeeze into the magazine.
SCORING & RANKING
The way test bikes are scored and ranked in shootouts will always be a contentious one, and – surprise, surprise – you never get consensus from all manufacturers over the methodology. But, after staging shootouts for 15 years, we’re confident that the way we go about it produces the most accurate and relevant feedback. In broad terms, here’s how it works:
- Testers fill out a detailed scorecard for each bike. That is then distilled into a score out of 10 for engine, suspension/steering and ergos/brakes. They do this alone to ensure their feedback in not influenced by other test riders.
- When test riders submit their scores, they are aggregated and subjected to a weighted average – 50% for engine, 40% for suspension/steering and 10% for ergos/brakes.
- We then sit down for a two-hour feedback session after the track testing to add dimension and detail to those scores. Here, the objective is to determine what sort of rider, terrain and riding style each bike best suits.
Why apply a weighted average to the scores? A few reasons:
- Because low scores for ergos (such as a too-soft seat or unconventional bar bend) are easy and relatively cheap to fix. Low scores for engine and suspension, on the other hand (poor throttle response at low revs or a deflecting fork, for example), are not only much costlier fixes; they also have a larger impact on the bike’s performance (and/or lap time potential).
- If we didn’t apply a weighted average, it could create misleading results. Let’s say Bike A scores 9 for engine, 9 for suspension and 6 for ergos. Bike B scores a 6 for engine, 9 for suspension and 9 for ergos. Both bikes’ total score adds up to 24, or an average of 8 out of 10. In which case, their overall raw scores would be identical. But which bike would you rather buy? Naturally, Bike A – because for some added seat foam and a $100 handlebar with a better bend, you’ll be way ahead of the bloke who bought Bike B and then had to spend $1000 on a pipe, cam and/or head porting to bolster its engine performance from a 6 to a 9 out of 10.
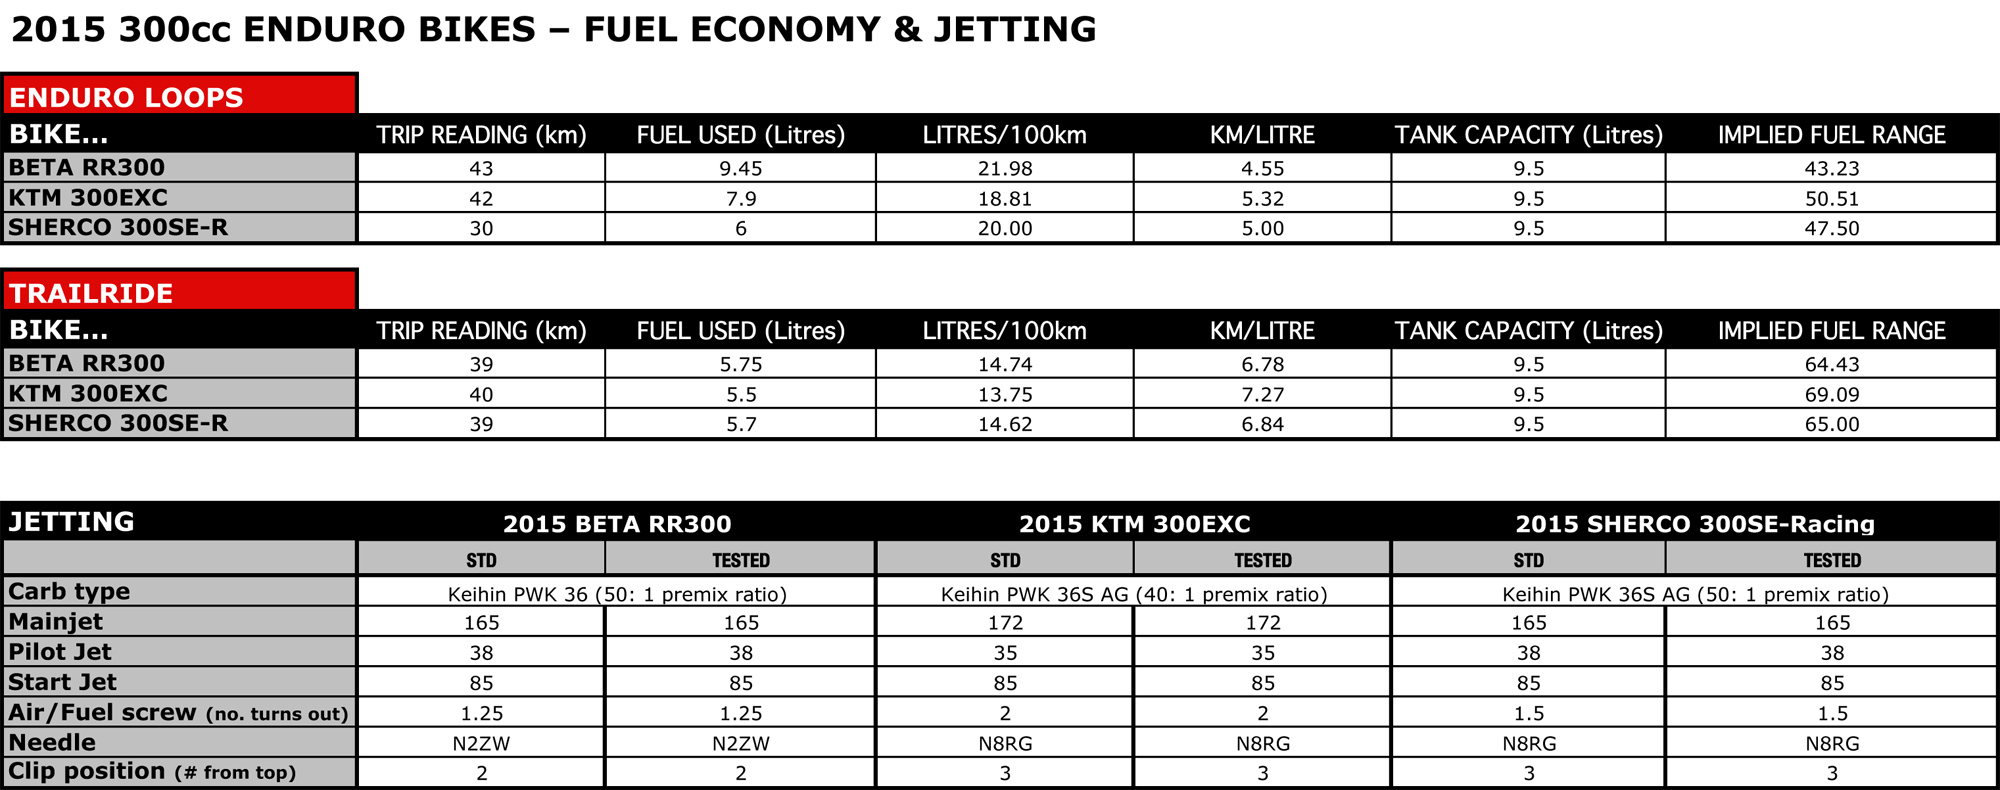
JETTING SPECS
You might also like...
Ducati
1 week ago
2026 Ducati Xpeditions Takes On Flinders
The six-day, 1800km adventure will take on the South Australian outback for Multistrada and DesertX riders.

2026 SMX WORLD CHAMPIONSHIP VIDEO PASS
The SMX Video Pass is back, and again providing live and on-demand access to all 31 rounds.
2026 ENDURO & CC MODELS: 7-BRAND PRICE COMPARO
A handy table of easy-to-compare prices for seven brands’ 2026 enduro and cross-country models.

HONDA CLAIMS EIGHTH AUSX TITLE
Dean Wilson sealed the deal for Honda with a dominant 2025 Australian Supercross season.
National Motorcycle Insurance
4 months ago
Ride Smart | Presented by National Motorcycle Insurance
Transmoto’s Simon Barratt covers some handy tips on how to protect your dirt bike, presented by National Motorcycle Insurance.
KTM
5 months ago
KTM DOMINATES 2025 AUSTRALIAN ENDURO CHAMPIONSHIP
The KTM DM31 Racing Team wrapped up four titles at the weekend’s AusEnduro season finale.

Boost Secures 2025 AUSX Naming Rights
The Australian Supercross Championship is set to launch into its biggest season yet.
TT Circuit Assen To Host 2027 MXoN
The 80th edition of the MXoN will see the legendary event return to Dutch soil in 2027.
Be the first to comment...